Great range of activities including:
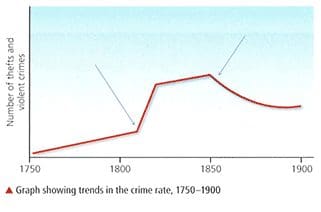
generating enquiry questions about increase in crime from a line graph; explanation builder to work out why; looking at individual punishments on a harshness spectrum and drawing on a range of sources to create an imaginative reconstruction of prison life.
Learning objectives
- Pupils grasp that the greatest change in punishments at this time was prisons
- Pupils can use information about crime rate from a line graph to raise enquiry questions for themselves
- Pupils can explain why there was such as growth in crime during this period.
- They understand that this was great period of growth in prisons: 90 new ones in first 40 years Victoria’s reign
- They can also explain why this period saw the start and growth of the Police force
Smart task 1
Step 1
Introduce the idea that crime rate increased dramatically at this time, by using the slow reveal of the