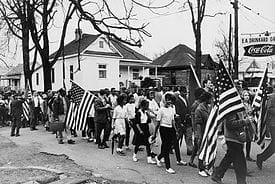
How far have Afro-Americans come in their struggle for equality over the last 160 years? With many schools operating a 2-year Key Stage 3 curriculum, it is important to offer a few quick overviews of topics you’d love to teach in greater depth, but simply don’t have the time. Rather than work through the topic chronologically and then run out of time, the approach with the full enquiry is to range over the last 160 year period asking the question about the true extent of equality for Afro-Americans. Pivotally, this lesson asks what the starting point was in 1950 and how far equality had been achieved by 1963. Students all investigate one incident each from the period 1950-63 but must eventually see these in terms of the overview. How much did each incident advance the cause?
The outline below forms the second part of a four lesson enquiry which spans the period 1860-2008.
Learning objectives
- Pupils can identify and explain the main turning points in the Civil Rights movement between 1950 and 1963. They can analyse and assess the relative significance of each event, giving reasons for their judgement and applying significance criteria.
- Pupils can use a range of words and phrases to describe significance
- Pupils can grasp and simply explain why not all accounts of this period attach the same degree of significance to each event
Step 1
To engage pupils’ interest they are told from the outset that they have to create a museum display to show how far the Civil Rights Movement had developed by 1963. (Slide 2 could act as a stimulus here.) In order to do this, they need both a clear chronology of events and a sense of the pictorial evidence that exists. The first activity links the two. Pupils are told that a museum in the US has sent a file of images for us to use but has not sent any captions or even dates. Can we work out, from what is shown on the pictures they have left us, what the images are referring to and what they are telling us? This open-ended start enables able pupils to predict, using any prior knowledge they may have, whilst lower-attaining pupils can still make simple deductions based on ‘internal’ clues’. Rather than showing just one image per event, I have included 2 or 3 to make it easier for those who will need more help. To assist them further, pupils can also access their textbooks. You can of course, remove some images from each lettered page to increase the level of challenge. Many will want to rise to the challenge of working it out for themselves first, without recourse to the textbook.
There are classroom organisation issues to consider here. If you have access to an ICT suite or set of portable laptops you could give the students the images on PowerPoint for them to caption and use Slidesorter to sequence. If you have a spacious classroom, pin the images (which you have printed from the PowerPoint presentation) around the room in random order, as if it was a picture gallery. Pupils then visit each image with a clipboard. They make notes on each image. Alternatively you could have images on table tops and ask pupils to pass them round in an orderly way.
Step 2
Just when the pupils are nearing the end of the first task, tell them that an email has arrived from the Civil Rights museum giving you the captions, but alas still no dates. So at least we can match the captions to the images. Print a copy of slide 11 for all pupils to add their own detail later as well as the letter of the image it is matched to. The timeline can easily be provided, on paper or electronically. These are worth using:
Step 3
Pupils now need to sequence the 8 events they have identified. Clearly, at this stage, pupils’ understanding of the events themselves is quite sketchy and needs strengthening before they can attempt the main part of the lesson.
Step 4
With all the images now placed in chronological order, with a basic caption for each, it is time to consolidate and deepen pupils’ understanding. You have now just received a PowerPoint presentation from the Museum showing their actual panels containing many of the images the pupils have just been working with. But what do the pupils think each panel will say?
Quickly tour through slides 11-18. After each one, ask them to predict what will be shown next on the next slide. This allows for prediction and reinforcement as well as being visually appealing. When you come to the last picture (slide18), ask which slide is missing. It is the Birmingham church bombings. A short BBC clip could be shown here. This is often left out of textbooks, as is the story of Emmett Till, but some think it is important.
Step 5
Pupils now work in groups researching ONE incident of their choice. They have the lesson and a homework to do this. Encourage them to communicate their findings by email or Facebook to each other. At the start of the next lesson each group is given 10 minutes to prepare a 60 second presentation on their topic. These are best presented in chronological order. Stress that all students need to listen carefully because they will be using the information later.
Step 6 (The second lesson)
With the presentations made, which normally takes the preparatory 5 minutes and the subsequent 10 minutes of presentations, the really hard work starts for the pupils in the next 35 minutes of this second lesson.
They have to quickly recall, in correct chronological order, the 8 events between 1950 and 1963 to feature in their museum. These should be written on blank slips of paper (about 1 cm wide, 8 cm long – NOT provided). These should then be placed in chronological order and turned through 90 degrees so they are at right angles to the table.
Pupils then have to make a decision about the relative importance of each event. If it is very important move it high up the table, if less important not so far up. Stress that each event usually builds on the previous success. Pupils now transfer the strips onto the template which you need to copy from slide 20. You could use slide 21 of the PowerPoint to show them the type of shape that might be expected, (both these slides are available to subscribers only) but don’t leave it displayed for too long, or pupils will simply copy it!
The aim is that pupils make fine adjustments to this living graph after they have heard different arguments. I have deliberately left the copy blank for you to draw the line as you see it. It helps if you can talk the pupils through your thinking as you draw. This metacognitive approach – i.e. the pupils hearing your thinking is very powerful. You might stress key points such as the relatively fallow time in the late 50s and the big surge in the early 60s.
Step 7
When they have created their refined shape, ask a few volunteers to come to the front and draw their approximate shape on the Interactive White Board. Do all groups agree? Modifications could be made in another colour or use the ‘rubber’ facility. As these modifications are made, stress three things:
- we need criteria for judging significance (slide 22 offers some examples);
- we need a language to describe degrees of importance (slide 26, gives 10 great examples);
- we need examples of how historians have described significance from textbooks (slides 23, 24) particularly where writers have clearly disagreed about importance (slide 25).
When you have put your own gloss on the graph’s shape, it is time for pupils to make their own copy which they then annotate to show the three most important improvements.
Step 8
For the rest of the lesson, pupils work in groups to produce a panel for their one event. They have just 60 seconds to write why it was important. Having spent time considering the event’s significance it is hoped that the captions on the panel will be more analytical and not just not plain description.
Next Lesson?
Pupils are now shown a short 90 second YouTube clip of an interview with Malcolm X who asserts that the Civil Rights movement had not achieved anything worthwhile. Pupils have to write a blog commenting on the Youtube video saying whether they think Malcolm X has been unfair to Martin Luther King and others. They have just 100 words to summarise their view.
Last Lesson
This then leads to a similar approach to the period 1964-2010, continuing the living graph but focussing mainly on where the graph should end. Are African-Americans really equal?


